Volatility Box:
tools:
account:
Part 1: Welcome Video
In this first onboarding video, you'll know what to expect through this entire video series.

Part 2: Quick 5 Minute Setup
In less than 5 minutes, we'll get you up and running with the Volatility Box indicator in your platform.
You can find the weekly pre-generated indicator files for the 116 symbols on the Indicator page. Click the green button at the top to download the indicator files.
Other related links:

Part 3: How to Think About Volatility Levels
In this section, I'll walk you through the logic behind volatility models and share a general framework to use the models in your trading.
There are 4 different models in total:
- VB Hourly Aggressive volatility (VBH_A..)
- VB Hourly Conservative volatility (VBH_C..)
- VB Daily Aggressive volatility (VBDA)
- VB Daily Conservative volatility (VBDC)
The best way to think about the models is that you have a volatility-based reason to now look for price to exhaust and reverse. The further down the levels we go, the more extended price becomes.

Part 4: Trade Plan
In this video, I'll share my Trade Plan that I use to trade the Stock VB levels. You can then tweak and customize the Trade Plan to work for your own trading style.
The basic setup is we are looking for a Volatility Box breach, and an Edge Signal confirmation to confirm the oversold / overbought move.
Other related links:
Download Edge Signals Indicator Updated

Part 5: How to Use the Live Scanner
In this video, I'll show you how to easily find volatility trades, using our custom built Live Scanner. Treat this scanner like your personal trading assistant, searching the market every 2 seconds for new, high-probability volatility trade setups.
Other related links:

Part 6: ThinkOrSwim Chart Settings and Buttons
In this video, I'll share tips and tricks to find the best settings in your ThinkOrSwim platform. I'll also spend some time showing you how to set up your toolbar, with quick-access buttons for the Volatility Box.
Other Related Links:

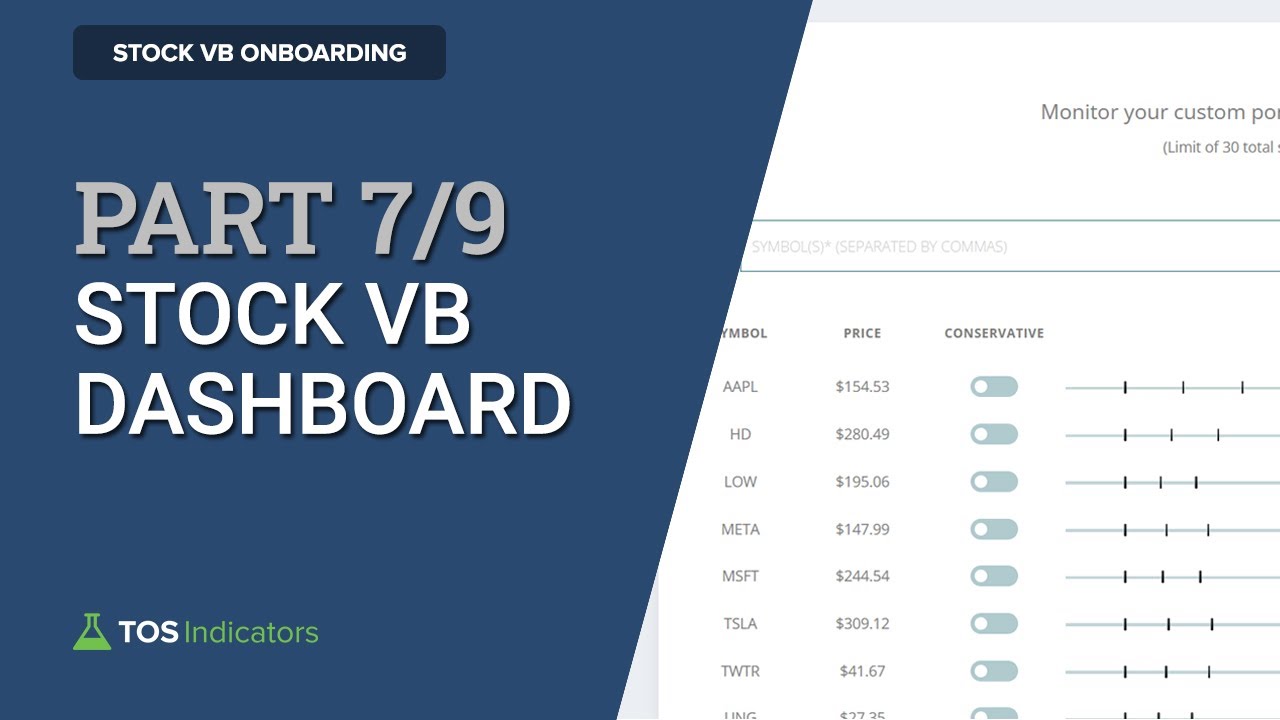
Part 7: How to Use the Dashboard
In this video, I'll show you how to easily plot the daily volatility models for any stock or ETF using our online dashboard. Using this approach, even if you don't have an indicator file for the stock, you can still view its daily volatility model's ranges in less than a second.
Other Related Links:
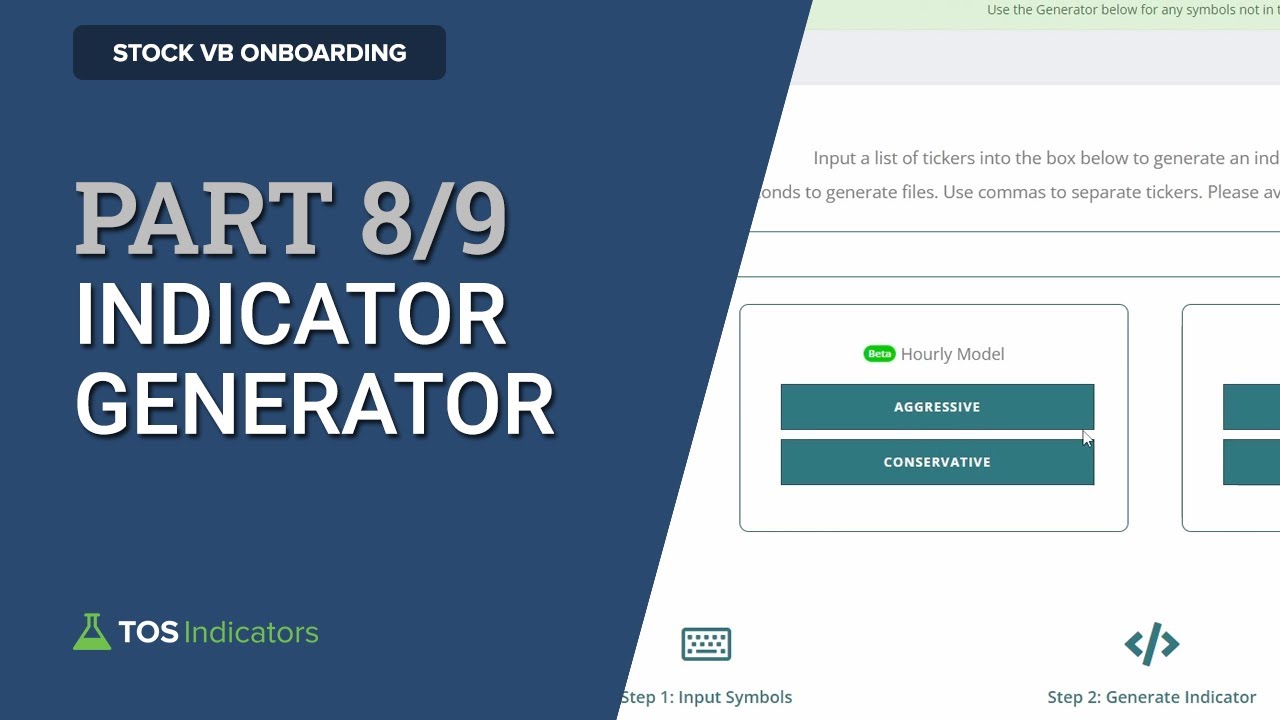
Part 8: Indicator Generator
In this video, I'll show you how to quickly create your own indicator files, with the appropriate volatility models you're looking for. You can create custom watchlists, or download our pre-generated indicator files, to have the volatility models every single week.
Other Related Links:
Part 9: How to Use the Short Interest Scanner
In this video, I'll show you how to find high short interest trade setups, with just a few clicks. Our Short Interest scanner makes it easy to find stocks that are in a squeeze, have stacked moving averages, and high short interest.
Other Related Links:
